Curso Análisis y visualización de datos
sl.ugr.es/bigdata
Tufte: principios para visualización de datos
Integridad
Tasa datos/tinta alta
Eliminación de chartjunk
Alta densidad de datos.
Lo que veremos
- Una gramática para gráficos:
ggplot2 - Creando informes automáticamente
- Usando herramientas online de visualización
ggplot2
Una gramática para gráficos que facilita las presentaciones.
> install.packages("ggplot2")
> install.packages("ggplot2")Datos: Elecciones UGR
sl.ugr.es/bdw_1R/qplot.R
library(ggplot2)
elecciones <- read.csv('../data/resultadoselecciones2015.csv')
qplot(elecciones$Sector, elecciones$Votos,
    color=elecciones$Candidato)
qplot(elecciones$Sector, elecciones$Votos,
    color=elecciones$Candidato,size=elecciones$Votos)
qplot(data=elecciones, x=Sector, y=Votos,
geom="bar",stat="identity", fill=Candidato)
ggsave("qplot-bar.png")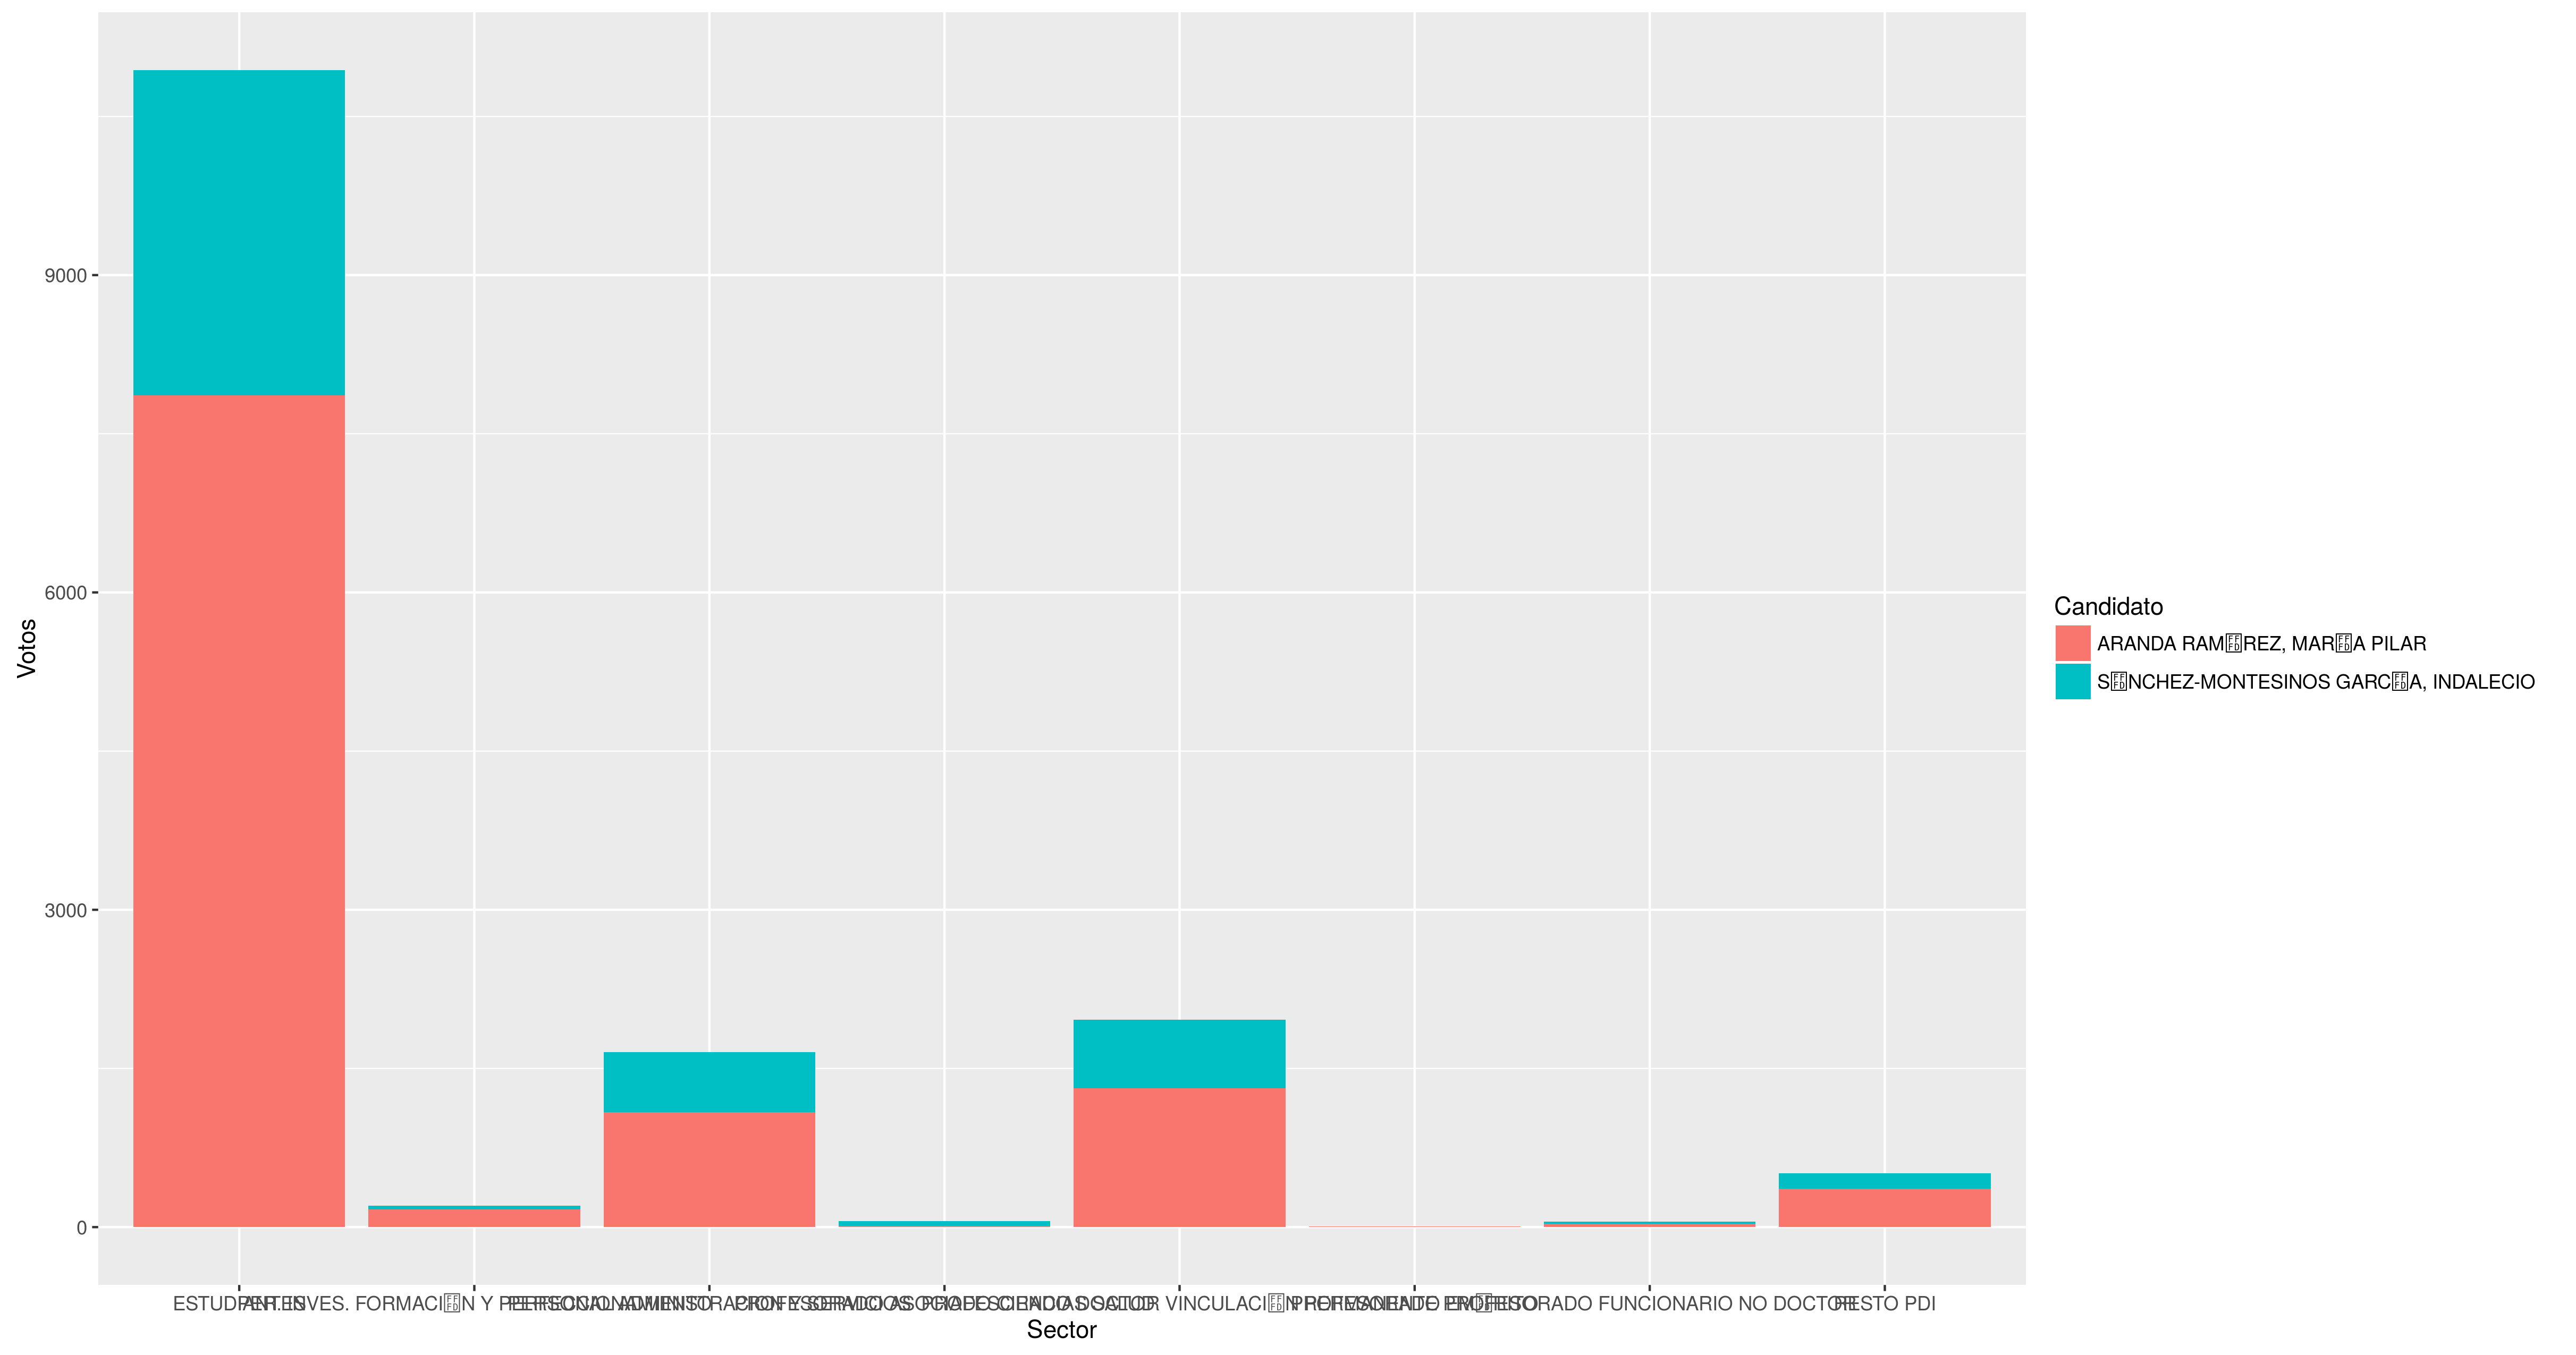
qplot(data=elecciones, x=Sector, y=Votos,
    geom="bar",stat="identity", fill=Candidato,
    facets=Candidato~Sector)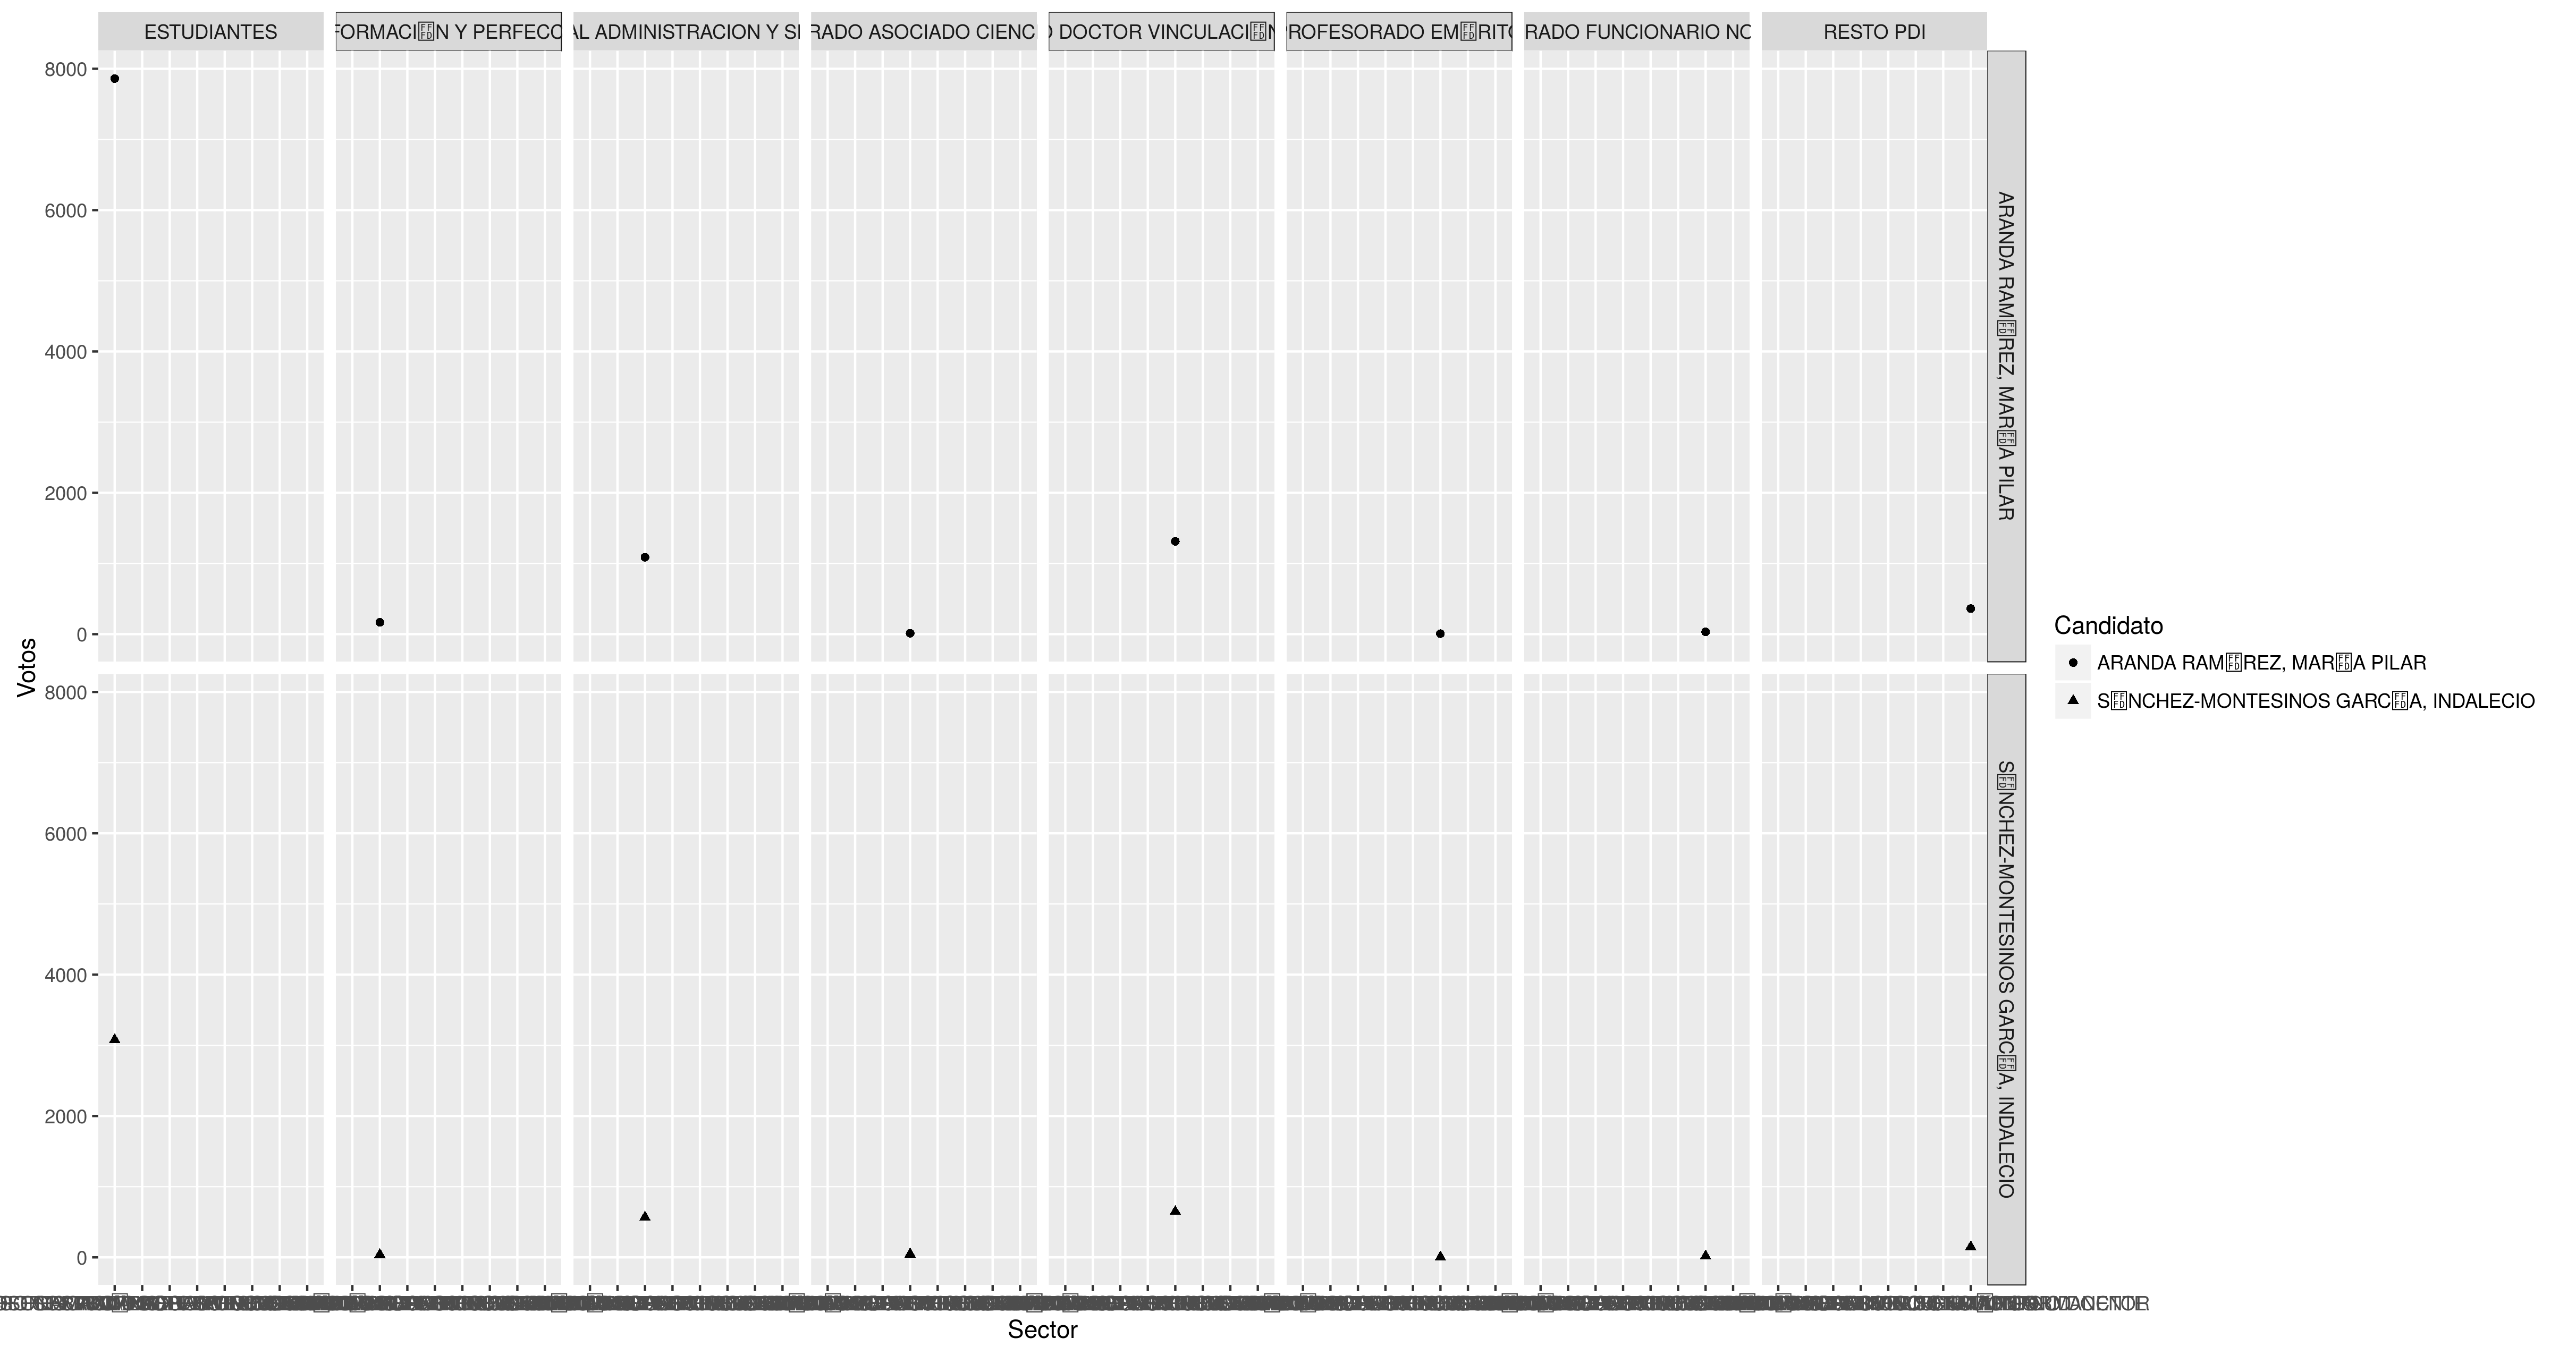
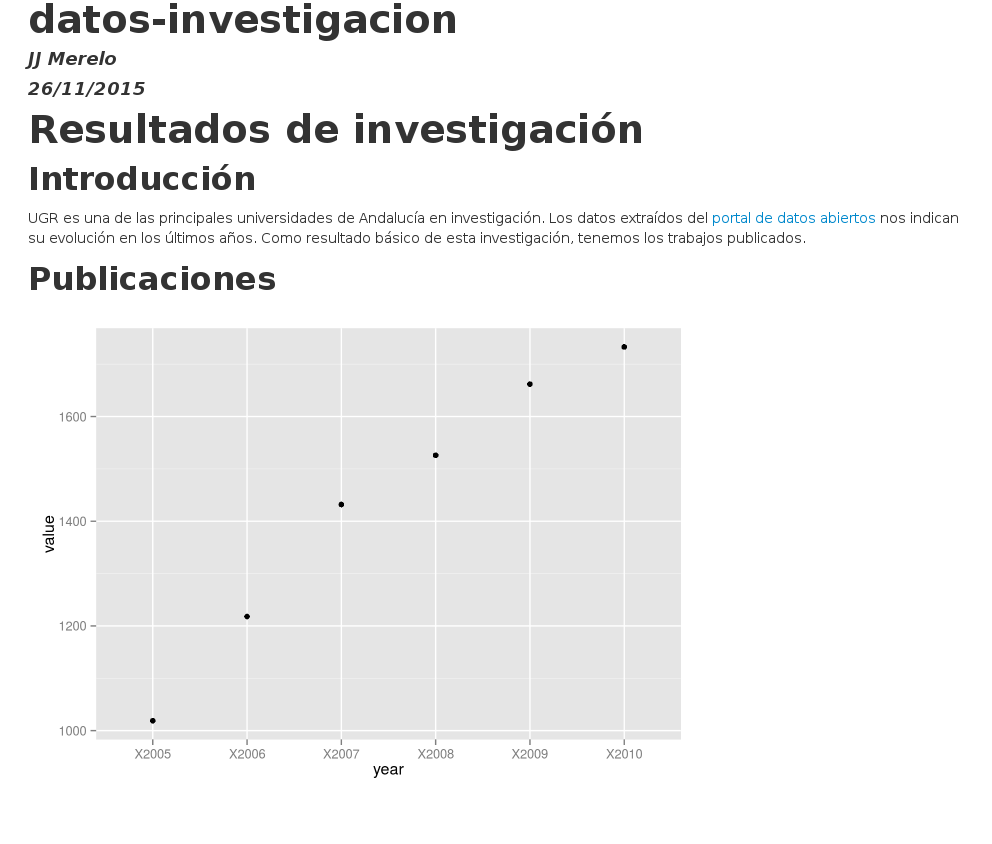
## Publicaciones
```{r, echo=FALSE, message=FALSE,results='hide',warning=FALSE}
library(ggplot2)
library(reshape2)
publicaciones.UGR
    <- investigacion.UGR[investigacion.UGR$Tipo.de.Estadística=="Publicaciones ISI",]
publicaciones.UGR.year
    <- melt(publicaciones.UGR,id.vars=1:2,variable.name="year")
pubs.WOS
    <- publicaciones.UGR.year[publicaciones.UGR.year$Denominación
        == "No. pub. WoS (Thomson)",]
pubs.WOS$value <- as.integer(pubs.WOS$value)
qplot(data=pubs.WOS,x=year,y=value)
```
ggplot()
ggplot() + geom_point(data=pubs.WOS, aes(x=year, y=value))+ combina gráficos
ggplot()
    +geom_point(data=pubs.WOS,
       aes(x=year,y=value,color='Todas'))
    +geom_point(data=pubs.WOS.citables,
       aes(x=year,y=value,color='Citables'))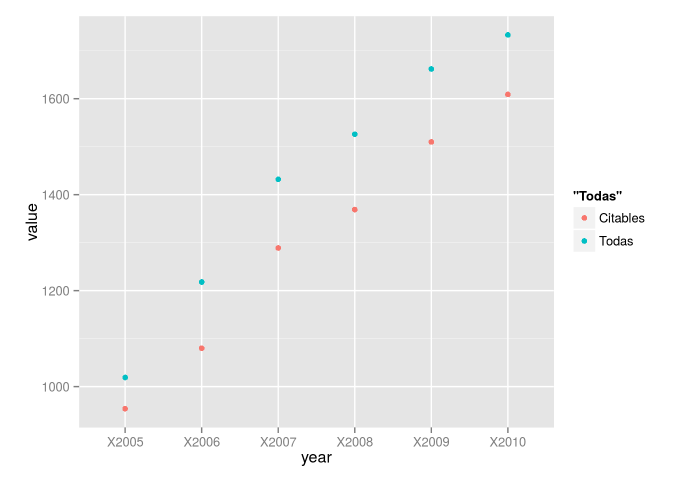
Cambiando colores, ejes, títulos...
docs.ggplot2.org/current/
ggthemes: Tufte (y más) para ggplot2
Usando Plotly para generar gráficos JS
votos.claustro <- read.csv("../data/claustro.csv")
votos.plot <- ggplot()
	      +geom_bar(data=votos.claustro,
	                aes(x=reorder(Nombre,-Votos),y=Votos,fill=Votos),stat='identity')
	      +theme_tufte()
	      +theme(axi s.text.x = element_text(angle = 90, hjust = 1))
plot_ly(votos.plot)